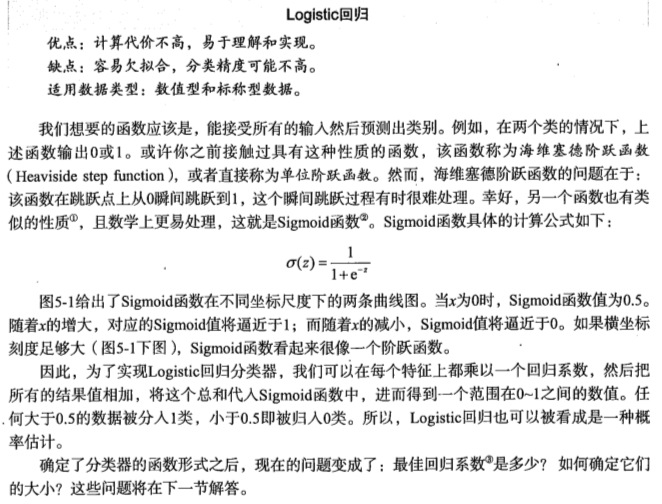
1.基于Logistic回归和Sigmoid函数的分类
2.基于最优化方法的最佳回归系数确定
2.1 梯度上升法
参考:机器学习——梯度下降算法
2.2 训练算法:使用梯度上升找到最佳参数
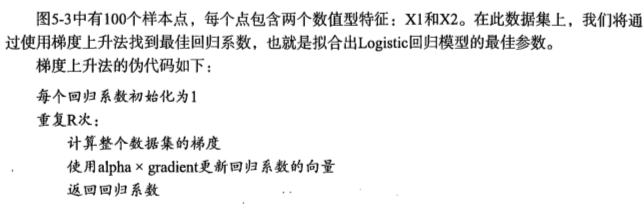
Logistic回归梯度上升优化算法
1 | def loadDataSet(): |
1 | dataMat,labelMat = loadDataSet() |
1 | [[ 4.12414349] |
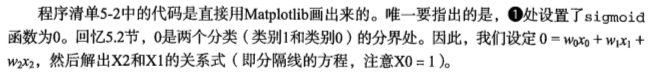
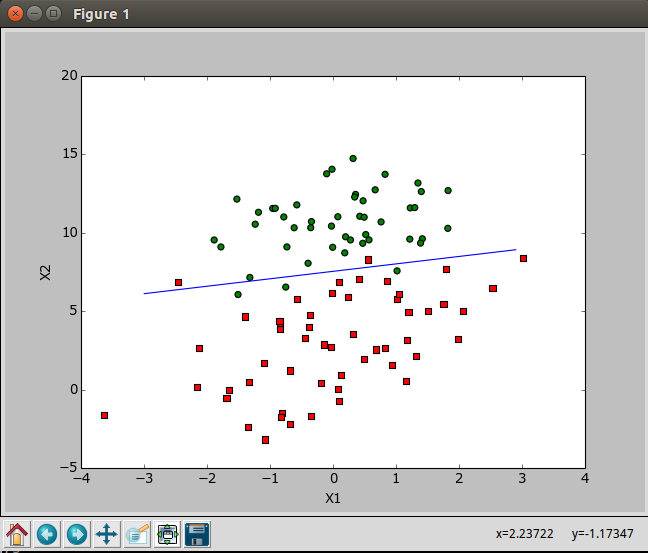
2.3 分析数据:画出决策边界
画出数据集和Logistic回归最佳拟合直线的函数
1 | def plotBestFit(wei): #画出数据集和Logistic回归最佳拟合直线的函数 |
1 | dataMat,labelMat = loadDataSet() |
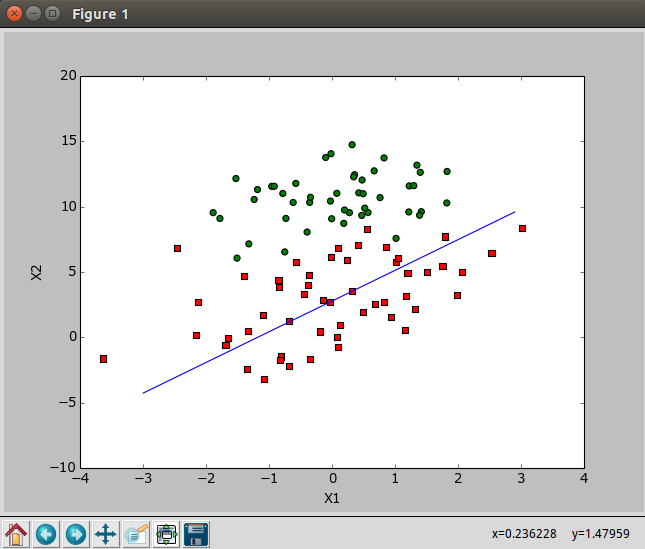
2.4 训练算法:随梯度上升
1 | def stocGradAscent0(dataMatrix, classLabels): #随机梯度上升算法 |
1 | dataMat,labelMat = loadDataSet() |
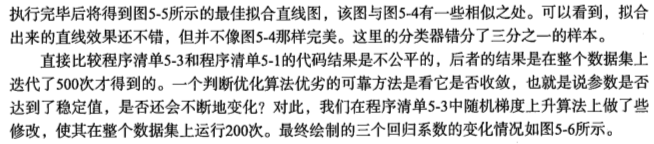
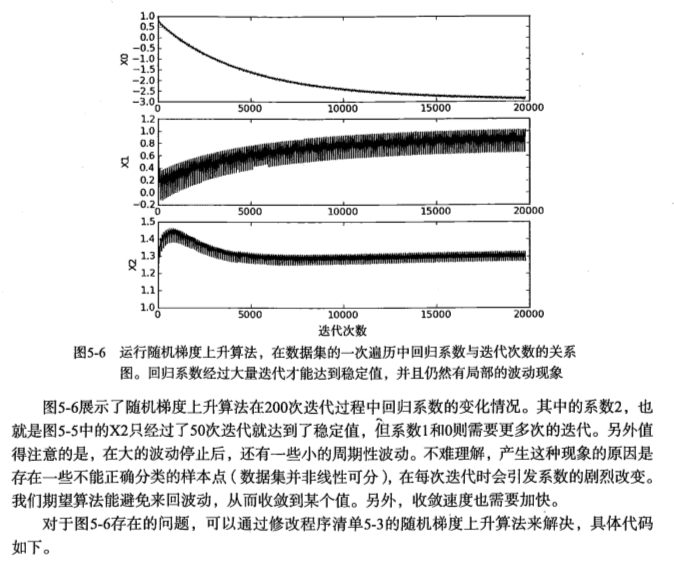
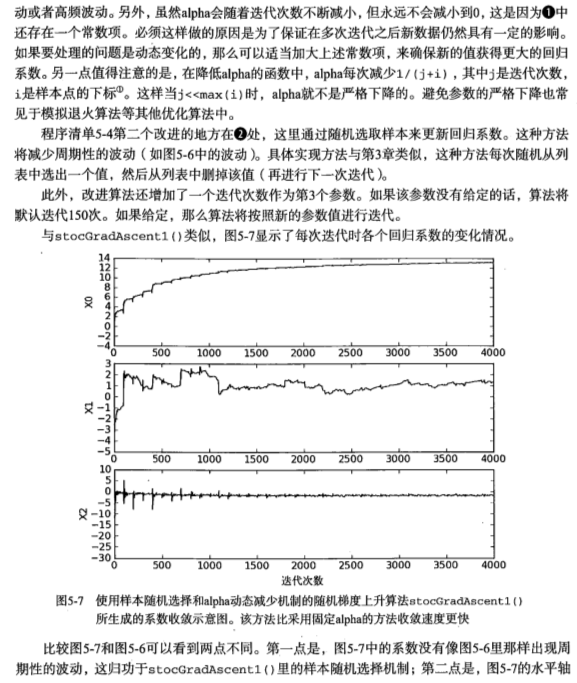
改进的随机梯度上升算法
1 | def stocGradAscent1(dataMatrix, classLabels, numIter=150): |


示例:从疝气病症预测病马的死亡率
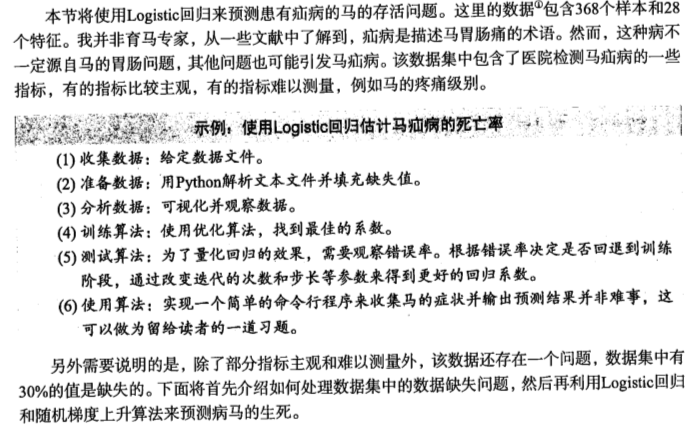
1.准备数据:处理数据中的缺失值
2.测试算法:使用Logistic回归进行分类
1 | def classifyVector(inX, weights): #输入回归系数和特征向量,计算出Sigmoid值,如果大于0.5则返回1,否则返回0 |