kudu支持的数据类型
1 | boolean |
kudu的建表语句
1 | CREATE TABLE sales_by_year( # 列存储 |
或者
1 | CREATE TABLE xxxx.xxxx( |
支持若干种分区方式:
kudu支持的数据类型
1 | boolean |
kudu的建表语句
1 | CREATE TABLE sales_by_year( # 列存储 |
或者
1 | CREATE TABLE xxxx.xxxx( |
支持若干种分区方式:
使用原生包管理工具安装kubectl
1.更新 apt 包索引,并安装使用 Kubernetes apt 仓库所需要的包
1 | sudo apt-get update |
2.下载 Google Cloud 公开签名秘钥,如果有网络问题的话,可以手动下载apt-key.gpg文件,然后将其改名并移动到/usr/share/keyrings/kubernetes-archive-keyring.gpg目录
1 | sudo curl -fsSLo /usr/share/keyrings/kubernetes-archive-keyring.gpg https://packages.cloud.google.com/apt/doc/apt-key.gpg |
3.添加 Kubernetes apt 仓库:
1 | echo "deb [signed-by=/usr/share/keyrings/kubernetes-archive-keyring.gpg] https://apt.kubernetes.io/ kubernetes-xenial main" | sudo tee /etc/apt/sources.list.d/kubernetes.list |
如果报错,可以使用中科大的源
1 | echo "deb [signed-by=/usr/share/keyrings/kubernetes-archive-keyring.gpg] http://mirrors.ustc.edu.cn/kubernetes/apt kubernetes-xenial main" | sudo tee /etc/apt/sources.list.d/kubernetes.list |
4.更新 apt 包索引,使之包含新的仓库并安装 kubectl:
Presto的语法解析器是使用ANTLR生成的
PrestoDB的parser g4语法文件
1 | https://github.com/prestodb/presto/blob/master/presto-parser/src/main/antlr4/com/facebook/presto/sql/parser/SqlBase.g4 |
PrestoSQL(Trino)的parser g4语法文件
1 | https://github.com/trinodb/trino/blob/master/core/trino-grammar/src/main/antlr4/io/trino/grammar/sql/SqlBase.g4 |
如果想在java代码中使用Presto的parser进行语法解析的话,可以引用下面的依赖
PrestoDB(Facebook版本)
1 | <dependency> |
PrestoSQL(社区版本,350及其以下版本叫prestosql,以上改名为Trino)
1 | <dependency> |
1 | jmap -dump:format=b,file=heap.hprof ${pid} |
如果生成快照的时候遇到如下报错
1 | Dumping heap to /mnt/tmp/heap.hprof ... |
添加如下参数就可以解决
1 | jmap -J-d64 -dump:format=b,file=/mnt/tmp/heap.hprof ${pid} |
如果机器的java版本是java8的话,需要注意MAT 1.12.0版本需要jdk11,所以下载1.10.0版本
1 | http://www.eclipse.org/downloads/download.php?file=/mat/1.10.0/rcp/MemoryAnalyzer-1.10.0.20200225-linux.gtk.x86_64.zip |
否则会出现如下报错
1 | Unrecognized option: --add-exports=java.base/jdk.internal.org.objectweb.asm=ALL-UNNAMED Error: Could not create the Java Virtual Machine. Error: A fatal exception has occurred. Program will exit. Unable to init server: Could not connect: Connection refused |
flink官方从1.8.0开始提供Table&SQL API,参考
1 | https://github.com/apache/flink/tree/release-1.8.0/flink-table |
如果想使用Flink SQL的话,可以参考官方的get start文档,如下
1 | https://nightlies.apache.org/flink/flink-docs-master/docs/dev/table/sql/gettingstarted/ |
找到flink的安装目录
1 | cd /usr/lib/flink |
首先需要启动一个flink集群,这里使用yarn-session模式来启动一个flink session集群,比如
1 | ./bin/yarn-session.sh -n 3 -s 5 -jm 1024 -tm 4096 -d |
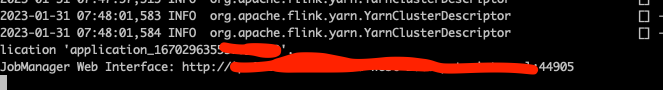
一旦flink集群启动,你就可以访问一个本地的FlinkUI
Flink的部署方式有如下几种,本文主要介绍standalone模式
1 | Yarn |
standalone模式的官方文档可以参考
1 | https://nightlies.apache.org/flink/flink-docs-master/docs/deployment/resource-providers/standalone/overview/#standalone |
进入flink的安装目录
1 | /usr/lib/flink |
启动一个standalone的flink集群
1 | ./bin/start-cluster.sh |
这时可以在默认的8081端口查看FlinkUI
提交任务
Java程序开启JMX的方法有2种:
第1种是在启动参数中添加如下配置
第2种是在环境变量中添加
官方JMX exporter
1 | https://github.com/prometheus/jmx_exporter |
jmxConnector.yaml配置如下
1 | lowercaseOutputName: false |
或者
1、net.core.somaxconn
net.core.somaxconn是Linux中的一个kernel参数,表示socket监听(listen)的backlog上限。什么是backlog呢?backlog就是socket的监听队列,当一个请求(request)尚未被处理或建立时,他会进入backlog。而socket server可以一次性处理backlog中的所有请求,处理后的请求不再位于监听队列中。当server处理请求较慢,以至于监听队列被填满后,新来的请求会被拒绝。在Hadoop 1.0中,参数ipc.server.listen.queue.size控制了服务端socket的监听队列长度,即backlog长度,默认值是128。而Linux的参数net.core.somaxconn默认值同样为128。当服务端繁忙时,如NameNode或JobTracker,128是远远不够的。这样就需要增大backlog,例如我们的3000台集群就将ipc.server.listen.queue.size设成了32768,为了使得整个参数达到预期效果,同样需要将kernel参数net.core.somaxconn设成一个大于等于32768的值。
2、net.ipv4.tcp_max_syn_backlog
表示SYN队列长度,默认1024,改成8192,可以容纳更多等待连接的网络连接数。
参考:Linux内核参数调优
3、编辑/etc/sysctl.conf
net.ipv4.tcp_syncookies = 1
net.ipv4.tcp_tw_reuse = 1
net.ipv4.tcp_tw_recycle = 1
net.ipv4.tcp_fin_timeout = 30
然后执行/sbin/sysctl -p让参数生效。
net.ipv4.tcp_syncookies = 1表示开启SYN Cookies。当出现SYN等待队列溢出时,启用cookies来处理,可防范少量SYN攻击,默认为0,表示关闭;
net.ipv4.tcp_tw_reuse = 1表示开启重用。允许将TIME-WAIT sockets重新用于新的TCP连接,默认为0,表示关闭;

1 | import java.io.File; |

1.使用 presto-client
1 | pip install presto-client==0.302.0 |
查询
1 | import presto |