1
2
3
4
5
6
7
8
9
10
11
12
13
14
15
16
17
18
19
20
21
22
23
24
25
26
27
28
29
30
31
32
33
34
35
36
37
38
39
40
41
42
43
44
45
46
47
48
49
50
51
52
53
54
55
56
57
58
59
60
61
62
63
64
65
66
| package graphx
import org.apache.spark.{SparkConf, SparkContext}
import org.apache.spark.graphx._
import org.apache.spark.rdd.RDD
import org.graphstream.graph.implementations.{AbstractEdge, SingleGraph, SingleNode}
/**
* Created by common on 18-1-22.
*/
object GraphxLearning {
def main(args: Array[String]): Unit = {
val conf = new SparkConf().setAppName("GraphX").setMaster("local")
val sc = new SparkContext(conf)
val path1 = "input/graphx/person.txt"
val path2 = "input/graphx/social.txt"
// 顶点RDD[顶点的id,顶点的属性值]
val users: RDD[(VertexId, (String, String))] = sc.textFile(path1).map { line =>
val vertexId = line.split(" ")(0).toLong
val vertexName = line.split(" ")(1)
(vertexId, (vertexName, vertexName))
}
// 边RDD[起始点id,终点id,边的属性(边的标注,边的权重等)]
val relationships: RDD[Edge[String]] = sc.textFile(path2).map { line =>
val arr = line.split(" ")
val edge = Edge(arr(0).toLong, arr(2).toLong, arr(1))
edge
}
// 默认(缺失)用户
//Define a default user in case there are relationship with missing user
val defaultUser = ("John Doe", "Missing")
//使用RDDs建立一个Graph(有许多建立Graph的数据来源和方法,后面会详细介绍)
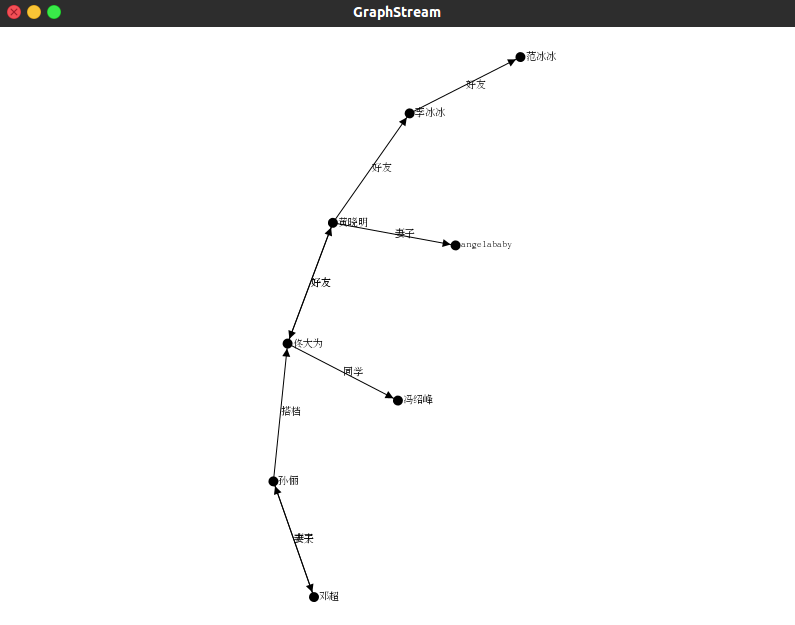
val srcGraph = Graph(users, relationships, defaultUser)
val graph: SingleGraph = new SingleGraph("graphDemo")
// load the graphx vertices into GraphStream
for ((id, name) <- srcGraph.vertices.collect()) {
val node = graph.addNode(id.toString).asInstanceOf[SingleNode]
node.addAttribute("ui.label", name._1)
}
// load the graphx edges into GraphStream edges
for (Edge(x, y, relation) <- srcGraph.edges.collect()) {
val edge = graph.addEdge(x.toString ++ y.toString, x.toString, y.toString, true).asInstanceOf[AbstractEdge]
edge.addAttribute("ui.label", relation)
}
graph.setAttribute("ui.quality")
graph.setAttribute("ui.antialias")
graph.display()
}
}
|